Friday Funnel Focus by EPOCH Sales Management Solutions
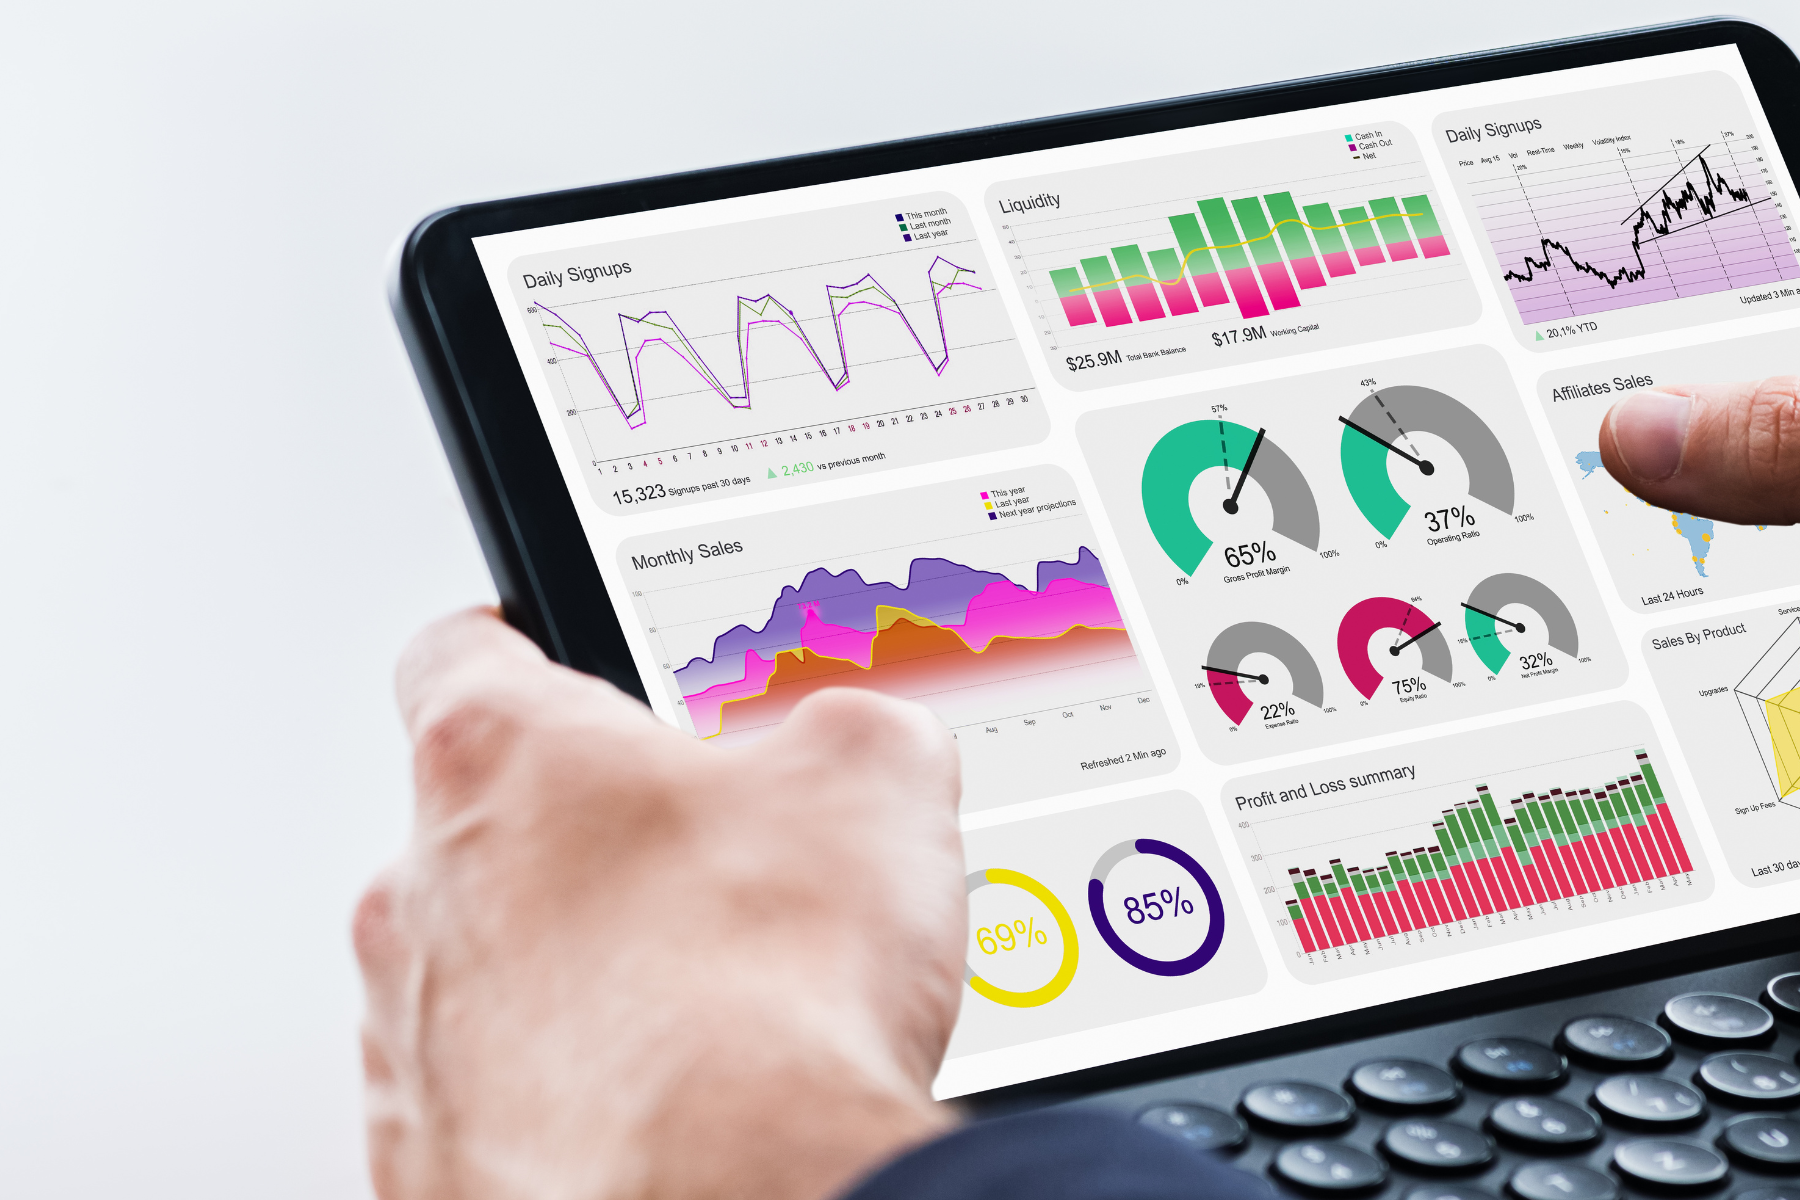
Creating effective sales dashboards to track key performance indicators (KPIs) is crucial for monitoring and improving the performance of your sales team. These dashboards should align with your selling objectives and business result goals. Use your CRM (Customer Relationship Management) system and any other tracking tools to gather this information. Here's a breakdown of the components you can include in your sales dashboards to ensure you're focusing on the right priorities:
Sales Results

Revenue and Sales Targets:
Display actual revenue and number of closed deals against your sales targets to see how well your team and each individual member is performing in terms of revenue generation.
Customer Acquisition Cost (CAC):
Calculate the cost of acquiring a new customer, which helps assess the efficiency of your sales efforts.
Show how well each salesperson is progressing toward their individual sales quotas.
Weekly Sales Results Dashboard
|
Dollars Won last week (versus Goal) by salesperson and company |
Dollars Won this Month to date (versus Goal) by salesperson and company |
Dollars Won this Quarter to Date (versus Goal) by salesperson and company |
|
# Deals Won this month to date (versus Goal) by salesperson and company |
List of Deals Won last 7 days |
List of Deals Lost last 7 days |
Monthly Sales Results Dashboard
|
Dollars Won last Month (versus Goal) by salesperson and company |
Dollars Won last Month by product/service type (future versus Goal) |
Dollars Won Fiscal Year to Date (versus Goal) by salesperson and company |
|
ASP last month by salesperson and company (versus Goal) |
Win Ratio last month by salesperson and company (versus Goal) |
Sales Cycle Length of won deals last month by salesperson and company |
Sales Pipeline Health
Pipeline Value:
Display the total value of all opportunities in the sales pipeline. This can be broken down by salesperson, product, or other relevant categories.
Pipeline Velocity and Deal Progress:
Monitor the average time it takes for an opportunity to move through the pipeline stages. Track the progress of individual deals, indicating where they are in the sales cycle. This can include stages like leads, prospects, negotiations, closed deals, and lost opportunities.
Win Rate:
Track the percentage of opportunities that successfully convert to closed deals.
Conversion Rates:
Measure conversion rates at each stage of the sales funnel to identify areas for improvement.
Aging Deals:
Identify opportunities that have been in the pipeline for an extended period, which may need special attention.
Discuss the current status of your sales pipeline. How many leads are in the pipeline, and at what stages are they? Assess the quality of the leads and their potential for conversion. Are there any bottlenecks or blockages in the pipeline?
Determine if the pipeline is sufficient to meet the sales goals for the upcoming month.
Weekly Sales Pipeline Dashboard
|
Dollars Closing this month (versus Goal) by salesperson and company |
Dollars Closing this quarter (versus Goal) by salesperson and company |
Dollars Closing this Fiscal Year (versus Goal) by salesperson and company |
|
# Deals Closing this month (versus Goal) by salesperson and company |
# Deals Closing this quarter (versus Goal) by salesperson and company |
List of Deals Closing this month by salesperson and company |
Monthly Sales Pipeline Dashboard
|
Stage Change Rate: Lead ID to Qualified by salesperson future -and company |
Stage Change Rate: Qualified to Proposed by salesperson future -and company |
Stage Change Rate: Proposed to Close by salesperson future -and company |
|
Sales Cycle Aging of pipeline by salesperson and company (versus Goal) |
Weighted Forecast this quarter by salesperson and company future – (versus Goal) |
Weighted Forecast this Fiscal Year by salesperson and company future (versus Goal) |
Sales Activities

Dig into the sales activity metrics to identify what changes need to be made. This may include the number of calls made, emails sent, meetings scheduled, and follow-ups performed by each salesperson.
Sales Calls/Meetings:
Track the number of sales calls or meetings held with prospects and customers.
Prospecting Activities:
Monitor the number of cold calls, emails, and other prospecting activities to ensure that your team is actively filling the pipeline.
Follow-up Activities:
Measure the effectiveness of follow-up actions and ensure that leads are not forgotten.
Based on the review of past results and the assessment of the current pipeline and sales activities, set specific, achievable targets for the coming month. These targets should be clear and quantifiable. Collaborate with your salespeople to develop action plans for achieving the set targets. Each team member should have a clear understanding of their responsibilities and tasks. Encourage open discussion and input from team members regarding strategies and tactics. Ensure that your sales team has the necessary resources, training, and support to execute their action plans successfully.
Weekly Sales Activity Dashboard
|
# New Opportunities last 7 days (versus Goal) by salesperson and company |
# (First Time) Appointments last 7 days (versus Goal) by salesperson and company |
# Connections last 7 days (versus Goal) by salesperson and company |
|
# New Opportunities this month (versus Goal) by salesperson and company |
# Total Touches last 7 days (versus Goal) by salesperson and company |
# Dials made last 7 days (versus Goal) by salesperson and company |
Monthly Sales Activity Dashboard
|
# New Opportunities this Fiscal Year (versus Goal) by salesperson and company |
# (First Time) Appointments last month (versus Goa) by salesperson and company |
# Connections last month (versus Goal) by salesperson and company |
|
# Phone Conversations last month (versus Goal) by salesperson and company |
# Phone Calls made last month (versus Goal) by salesperson and company |
# Total Touches last month (versus Goal) by salesperson and company |
When setting up these dashboards, consider the following best practices.
Real-Time Updates:
Ensure that your dashboards are updated in real time or at least frequently enough to provide accurate and actionable insights.
Customization:
Tailor your dashboards to match your unique selling objectives and business goals. Different teams or individuals may require specific KPIs.
Visualization:
Use charts, graphs, and tables to make data easily digestible. Visual representations help quickly identify trends and issues.
Benchmarking:
Compare current data with historical performance to track progress and identify areas that need improvement.
Goal Setting:
Clearly define your new opportunity goals and regularly review progress towards these goals with your team.
Data Integration:
Integrate your dashboards with your CRM (Customer Relationship Management) system and other relevant tools to ensure accurate and up-to-date data.
Accessibility:
Make the dashboards accessible to all team members so that they can track their performance and make data-driven decisions.
Regular Review:
Schedule regular reviews and discussions around the data presented in the dashboards to address challenges and celebrate successes.
By building and utilizing these dashboards effectively, you can align your sales team with your business goals, track their performance, and make data-driven decisions to focus on the right priorities and improve sales outcomes.
Daily Sales Dashboard
|
New Business Opportunities Closing in the Next 30 Days Supports #1 Sales Priorities - Get Paid - What can you do today to close something today, this week, this month. |
New Business Opportunities Created This Month How are you doing at meeting your new opportunity goal creation this month? |
Sales Activities for Today and This Week What activities do you have today and this week to meet your sales goals? |
|
New Business Opportunities with Closed Date over 90 days Maintain a clean pipeline. Are these opportunities still valid? |
Deals Won this month Celebrate your wins! How are you doing against your sales target? |
New Business Opportunities Open beyond Close Date Why did these not close? Are they still valid? What needs to be done to close them? |
Want to hire and keep SUCCESSFUL salespeople?
Want to break through that plateau?
We believe the first step is to Make Your Business .. Sales Team Ready.
Do you struggle to find the right salesperson?
You may not even know what is it that you want in a SUCCESSFUL salesperson.
If you struggle with this...

We help small business owners scale their teams from themselves to 5 salespeople and beyond.
Schedule today a DISCOVERY consultation with Dave Priddy!